Last updated on October 22nd, 2023 at 04:16 pm
Graphs for motion at constant velocity are shown below: (स्थिर वेग पर गति के लिए motion ग्राफ़). Then these are explained as well.
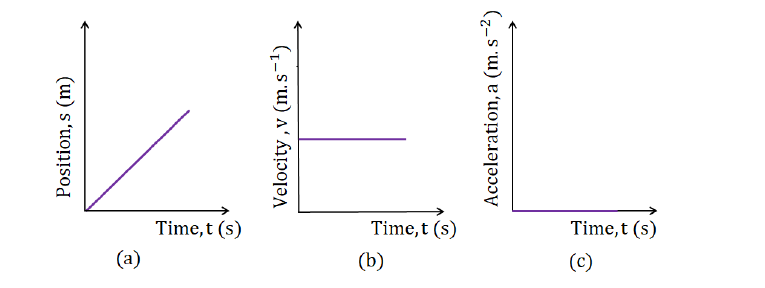
Position – time graph for constant velocity motion
The graph follows the equation s = vt where v is constant. When t = 0, then s = 0. Thus the position-time graph for constant velocity is a straight line starting from (0.0) with a uniform slope (figure 1a).
ग्राफ समीकरण s = vt का अनुसरण करता है जहां v स्थिर है। जब t = 0, तो s = 0। इस प्रकार स्थिर वेग के लिए स्थिति-समय ग्राफ एक सीधी रेखा है जो एक समान ढलान (चित्रा 1 a) के साथ (0,0) से शुरू होती है।
Velocity – time graph when velocity is constant
The graph is a horizontal line as shown in figure 1b. At any time instant velocity is the same, thus the horizontal line is made.
ग्राफ एक क्षैतिज रेखा है जैसा कि चित्र 1 बी में दिखाया गया है। किसी भी समय instant velocity समान होता है, इस प्रकार क्षैतिज रेखा बनाई जाती है।
Acceleration – time graph when velocity is constant
As velocity is constant so acceleration a = dv/dt = 0
See Figure 1c for this graph, where for any t the value of acceleration is zero.
चूंकि वेग स्थिर है, इसलिए त्वरण a = dv/dt = 0
इस ग्राफ़ के लिए चित्र 1c देखें, जहाँ किसी भी t के लिए त्वरण का मान शून्य है।